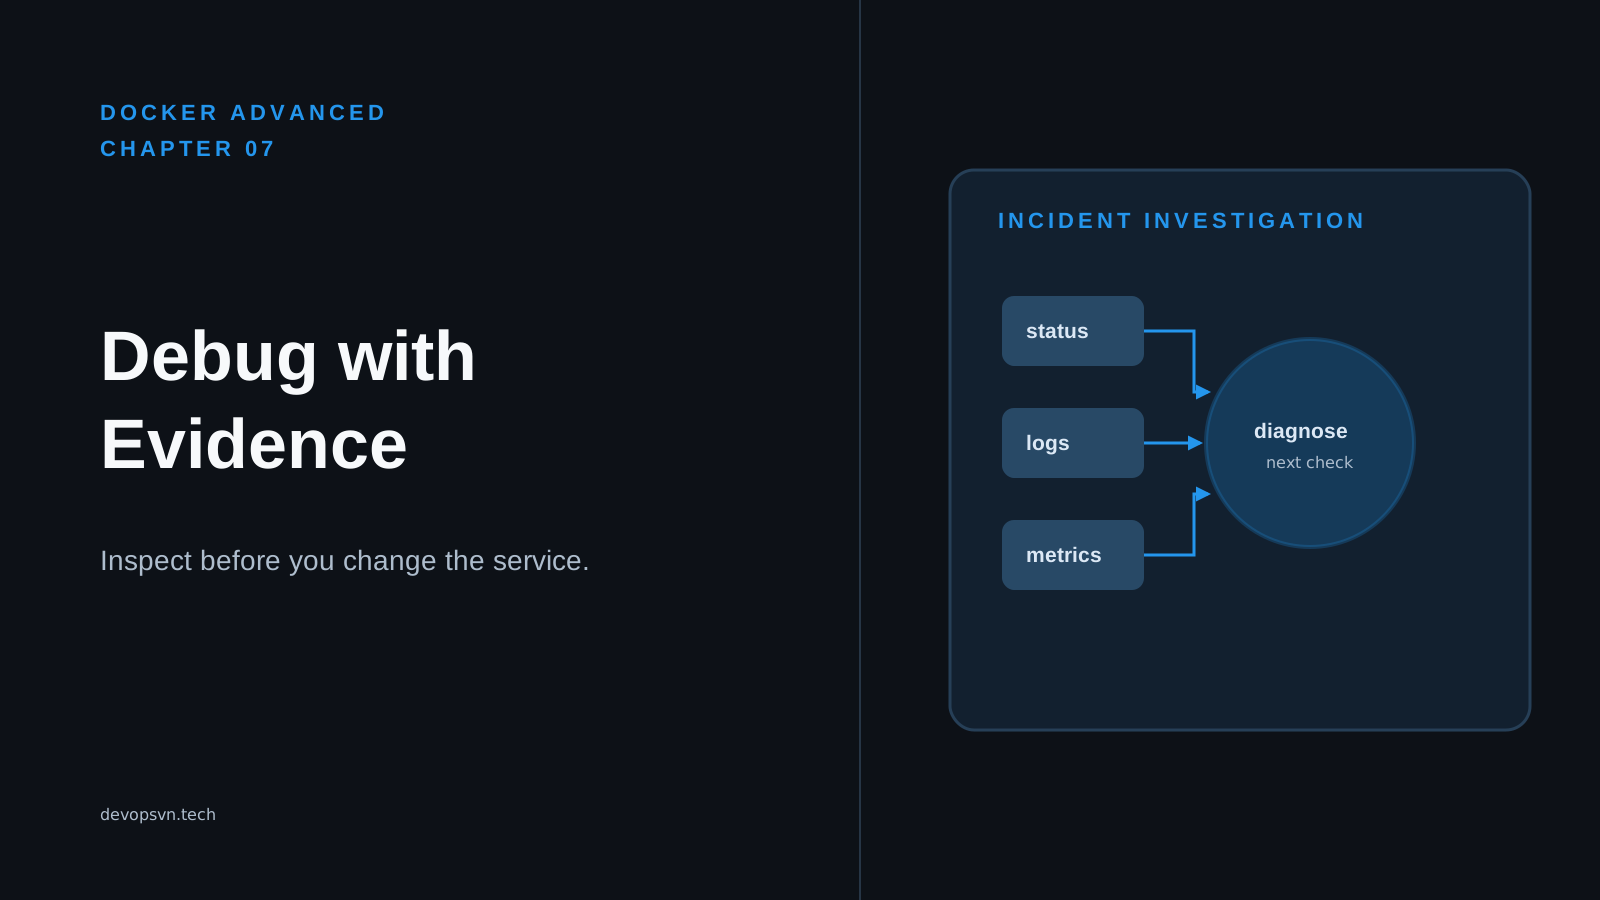
A container that restarts every few seconds has already failed at least once, but its restart policy can hide the original cause. Restarting Docker or raising a memory limit may briefly change the symptom without identifying whether the failure came from application code, configuration, a dependency, or resource exhaustion.
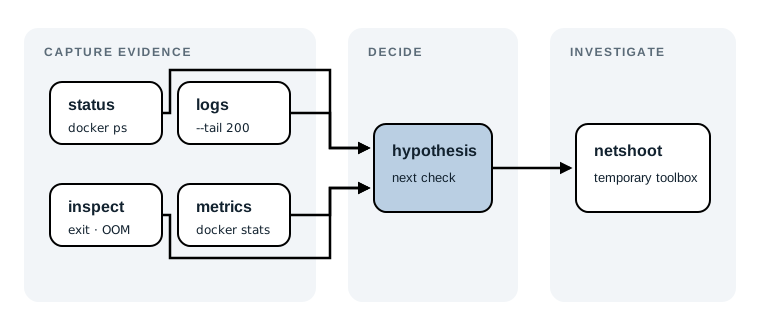
Start with evidence instead. Capture the container’s state, its last output, its effective configuration, and its recent resource use before changing the thing you are trying to understand. In this chapter, you will use that order to investigate a failing container, compare it with a working peer, test its network namespace without modifying its image, and decide which logs, metrics, and traces must survive the next restart.
Code for this chapter. The repeatable first-capture script is in 07-debugging-and-observability.
Start with a failing container
This chapter uses task-api as a container name. It is a placeholder, not a container supplied by the resource. Replace it with the name or ID reported by your own alert or docker ps. A container name is easier to read during an incident; a container ID is safer when several similarly named containers exist.
First, list every container, including ones that already stopped:
docker ps -a --no-trunc \
  --format 'table {{.ID}}\t{{.Names}}\t{{.Status}}\t{{.Image}}'
docker ps -a asks Docker for running and stopped containers. --no-trunc preserves full IDs, and --format limits the output to the identity, name, state, and image that matter at the start. Expect a table with one row for the affected service. A status such as Up 4 minutes means its main process is still running. Restarting (1) 8 seconds ago means Docker has already started it again after a non-zero exit. Exited (137) gives you an exit code to investigate; it is evidence, not yet a diagnosis.
Do not begin with docker restart. A restart replaces the recent process with a new one and can remove the easiest path to the original error. If a container is flapping rapidly, copy its ID or name now. The rest of the first pass is read-only.
Use the first-capture script
The resource contains debug.sh:
#!/usr/bin/env sh
set -eu

container_name=${1:?Usage: debug.sh CONTAINER}
docker logs --tail 200 "$container_name"
docker inspect "$container_name" --format '{{.State.ExitCode}} {{.State.OOMKilled}}'
docker stats --no-stream "$container_name"
Run it from the resource directory with the affected container name:
cd _resource/docker-advanced/07-debugging-and-observability
sh debug.sh task-api
Here, task-api is the required CONTAINER argument. The script stops immediately when it is omitted because ${1:?...} prints Usage: debug.sh CONTAINER; set -e also stops on a failed Docker command, and set -u catches an unset shell variable. That prevents a partial capture from looking complete.
The expected result has three sections in sequence: up to 200 recent log lines, an exit-code and OOM flag line such as 1 false, and one docker stats row. If the container has already been removed, Docker reports that it cannot find it and the script stops. That is a real operational gap: retain failed containers long enough to inspect them, or send their logs and events to storage outside the Docker host.
The script deliberately does not claim what 1 false means. It means the process last exited with code 1, and Docker did not record an out-of-memory kill. The logs and inspect data decide whether that was a missing environment variable, a refused database connection, or application code calling exit(1).
Read status as a timeline
Container status is Docker’s view of the process lifecycle. It answers whether the process is alive, how recently it changed state, and whether Docker is restarting it. It cannot tell you whether the API can serve a real request.
Ask Docker for the exact state timestamps and restart count:
docker inspect task-api \
  --format 'status={{.State.Status}} running={{.State.Running}} restart_count={{.RestartCount}} started={{.State.StartedAt}} finished={{.State.FinishedAt}} exit_code={{.State.ExitCode}} oom_killed={{.State.OOMKilled}} error={{json .State.Error}}'
The command reads metadata; it does not execute anything in the container. Expect one line. For a crash loop, status=running may be true at the instant Docker samples it, while restart_count climbs and finished is from the preceding attempt. An exit_code of 0 often means the command completed normally, which is still a failure for a service that should stay running. An exit code of 137 commonly appears after SIGKILL, but do not call it an OOM event unless oom_killed=true or host evidence confirms it. Docker’s error field can expose runtime setup failures before the application process starts.
If this output says running=true and restart_count=0, the alert may be about health or reachability rather than a crash. Keep the same evidence-first order, but do not chase an exit code that does not exist.
Let logs explain the last failure
Application logs are the process’s own account of what happened. Docker shows standard output and standard error through its configured logging driver. Start near the failure instead of opening a terminal that scrolls through days of unrelated requests:
docker logs --tail 200 --timestamps task-api
--tail 200 bounds the capture to the last 200 lines, which is the same limit used by debug.sh. --timestamps lets you line up an application message with StartedAt, FinishedAt, an alert, or a deployment. Expect startup lines followed by either a normal ready message or a useful error. A line such as connect ECONNREFUSED database:5432 supports a dependency or network branch. A line such as missing required environment variable DATABASE_URL supports a configuration branch. A blank result means only that Docker has no output through this logging path; it does not prove the service was healthy.
For a container that is currently running but failing requests, follow only new output while another person makes one reproducible request:
docker logs --follow --timestamps --tail 50 task-api
--follow keeps the command attached, and --tail 50 gives enough preceding context to recognize the request. Expect a new log line that shares a request ID, path, or error with the failed request. Press Ctrl-C when you have captured it; that stops log following, not the container. If no line appears, either the application did not receive the request or its logs do not record that path. The next check is configuration and network reachability, not a second guess at the log level.
Warning: Logs often contain request headers, SQL errors, and exception context. Capture and share them through the incident channel that is approved for production data. Do not paste secrets into tickets or add verbose logging blindly while an incident is active.
Inspect the configuration Docker actually used
The file used during a deployment is an intention. docker inspect shows the effective configuration of the container Docker created: image digest, command, environment variable names and values, mounts, labels, network attachments, and health state. This is how you catch a configuration value that was correct in Git but absent from the running container.
Start with the image, command, working directory, and restart policy:
docker inspect task-api \
  --format 'image={{.Image}} command={{json .Config.Cmd}} workdir={{json .Config.WorkingDir}} restart={{.HostConfig.RestartPolicy.Name}}'
Expect one line. .Image is an immutable local image ID, while .Config.Cmd is the command Docker passed to the image. A surprising command, working directory, or restart=no can explain behavior that a source Dockerfile does not. The image ID alone is not the remote registry digest, but it is enough to compare two containers on the same host.
Next, print the environment supplied to this container:
docker inspect task-api --format '{{range .Config.Env}}{{println .}}{{end}}' | sort
This prints KEY=value lines in a stable order. Expect the variables that your service needs, with no unexpected development overrides. Treat the output as sensitive because it can include credentials. If the investigation only needs to establish whether a key exists, use this safer variant instead:
docker inspect task-api --format '{{range .Config.Env}}{{println .}}{{end}}' \
  | cut -d= -f1 \
  | sort
The second command deliberately removes values after the first =. Expect names such as DATABASE_URL or LOG_LEVEL, depending on your service. A missing name supports configuration drift; a present name does not prove its value is valid.
Finally, inspect health separately from process state:
docker inspect task-api \
  --format 'health={{if .State.Health}}{{.State.Health.Status}}{{else}}not-configured{{end}}'
Expect healthy, unhealthy, starting, or not-configured. unhealthy means Docker’s configured health-check command failed; it does not necessarily mean the process exited. Inspect the most recent health-check output when it is unhealthy:
docker inspect task-api \
  --format '{{range .State.Health.Log}}{{printf "%s exit=%d %s\n" .End .ExitCode .Output}}{{end}}'
Expect timestamped attempts and their output. A connection refusal here means the check could not reach the application’s local endpoint. A shell error such as wget: not found means the health-check tool is missing from the image, so repair the image or use a check tool it contains. Do not disable a health check merely because it found a problem.
Compare a failing container with a working one
Configuration drift is an unintended difference between two environments or two instances that should be equivalent. It is common after an urgent manual change, a stale Compose override, an image tag that moved, or a secret rotation. A comparison turns “it works over there” into a small list of facts.
Choose one working peer on the same host and inspect both image IDs and commands:
docker inspect task-api task-api-working \
  --format '{{.Name}} image={{.Image}} command={{json .Config.Cmd}}'
task-api-working is another placeholder. Replace it with a known-good container running the same intended release. Expect two lines. Different image IDs indicate different local image content, even if a mutable tag looked the same in a deployment file. Different commands can expose an override or a one-off manual start.
Compare environment variable names without disclosing values:
for container_name in task-api task-api-working; do
  printf '%s\n' "[$container_name]"
  docker inspect "$container_name" --format '{{range .Config.Env}}{{println .}}{{end}}' \
    | cut -d= -f1 \
    | sort
done
The loop prints a labeled, sorted list for each container. Expect the same required keys in both lists. An absent DATABASE_URL in the failing instance is enough to explain a startup error without exposing either database credential. Equal names are not the end of the comparison: validate sensitive values through your secret manager and deployment records, rather than printing them to a shared terminal.
Compare mounts and network names as well:
docker inspect task-api task-api-working \
  --format '{{.Name}} mounts={{range .Mounts}}{{.Destination}} {{end}}networks={{range $name, $_ := .NetworkSettings.Networks}}{{$name}} {{end}}'
Expect each container to report the same intended writable paths and networks. A missing configuration mount or the wrong network often explains a service that starts but cannot find a file or dependency. This check reports attachment names, not whether the dependency answers. Test reachability next.
Use a temporary network toolbox
A minimal production image may not contain a shell, DNS client, or HTTP client. Installing those tools into the failing container changes the evidence and may be impossible with a read-only filesystem. Use an ephemeral toolbox: a separate short-lived container that joins the target container’s network namespace.
The following command requires the nicolaka/netshoot toolbox image to be available to Docker. It is not included in this repository. Pull and approve that image through your organization’s normal image process before an incident; do not make a new external image dependency in the middle of an outage. With an approved local copy, run:
docker run --rm -it \
  --network container:task-api \
  nicolaka/netshoot \
  sh
--network container:task-api makes the toolbox share task-api’s network namespace, including its interfaces, routes, and DNS configuration. --rm removes the toolbox when you exit. Expect an interactive shell in the toolbox, not a shell inside task-api; the target image and filesystem remain unchanged. Replace task-api with the affected container name.
From that toolbox shell, test DNS resolution for the dependency hostname shown in the application configuration:
dig database
database is a placeholder for the actual service hostname, not a name defined by this resource. Expect an answer section with an address when Docker DNS can resolve it. NXDOMAIN or a timeout supports the wrong-network, wrong-hostname, or DNS branch. A successful answer proves only name resolution; it does not prove that the database accepts a connection.
Then test the dependency port:
nc -vz database 5432
Both database and 5432 are placeholders. Replace them with the hostname and port your application is configured to use. Expect succeeded when a TCP listener accepts the connection. Connection refused means the network path reached a host but no process accepted that port. A timeout points toward routing, firewall rules, a disconnected network, or a dependency that is unavailable. Do not interpret a successful TCP connection as successful authentication or a valid query.
Exit with exit when the test is complete. The toolbox disappears because of --rm; its output is not durable evidence. Copy useful command results into the incident record, and use the next section’s telemetry for ongoing visibility.
Follow the branch, not the hunch
Consider a realistic result from the first capture:
Error: connect ECONNREFUSED database:5432
1 false
The log identifies a refused connection. The state line says the application chose exit code 1, and Docker did not flag an OOM kill. Increasing the memory limit would not follow from this evidence.
Run the toolbox DNS and port checks. If dig database resolves an address but nc -vz database 5432 reports Connection refused, Docker DNS and the API’s network namespace are working. The next owner is the database service or its listener configuration. Inspect that service’s status and logs, then check whether it listens on the port the API was configured to use.
If dig database returns NXDOMAIN, compare the API’s network attachments and environment keys with the working peer. A missing shared network or an environment value using an old hostname is more likely than a database process failure. Fix the deployment configuration, create a new container from that declared configuration, and capture the same status and log checks afterward. Do not patch /etc/hosts inside the API container; it will disappear on the next replacement and leaves the declared deployment wrong.
There is a tradeoff in this method. Capturing and comparing evidence takes a few minutes while an alert is active. Restarting or changing a limit feels faster. But a restart can turn a specific dependency error into a generic recovery loop, and an unmeasured configuration change can create the next incident. When immediate restoration is necessary, record the command and timestamp first, then return to the preserved external evidence.
Keep evidence after the container is gone
docker logs, docker inspect, and docker stats are host-local tools. They are excellent for a live incident on one Docker host. They are weak as the only observability plan: a container can be removed, a host can fail, log rotation can discard the clue, and one docker stats --no-stream sample cannot explain a memory trend.
Observability is the ability to understand a system’s state from its outputs. For a containerized service, keep three durable signal types outside the disposable container:
- Logs are timestamped event records. Send standard output and error to a centralized log system with container name, image digest, deployment revision, and request or correlation ID as searchable fields. Keep retention long enough for your incident and rollback window.
- Metrics are numeric measurements over time, such as request rate, error rate, latency, CPU, memory, restart count, and health state. Scrape or collect both application metrics and container/runtime metrics. An alert on rising memory is more useful with a graph that shows whether it began after a release.
- Traces connect one request across services. Propagate a trace or correlation ID from the entry point into application logs and downstream calls. A trace can show that the API reached the database but waited on a slow query, which a container-level CPU graph cannot tell you.
For a local snapshot during diagnosis, keep using the resource script:
sh _resource/docker-advanced/07-debugging-and-observability/debug.sh task-api
The expected result is the same bounded logs, state line, and stats row described earlier. It is appropriate for a quick point-in-time capture and for attaching evidence to an incident note. It is not a substitute for continuous metrics: --no-stream intentionally exits after one sample. For production, let your chosen logging, metrics, and tracing systems collect continuously, and make sure their own credentials and endpoints are configured outside the application image.
Summary
- Begin an incident with
docker ps -a, then preserve logs, state, and one resource snapshot before restarting or changing the service. - Use
docker inspectto separate a stopped process, an unhealthy running process, an OOM kill, and an effective configuration that differs from the deployment intent. - Compare image identity, command, environment-key names, mounts, and networks with a working peer to find configuration drift without exposing secrets.
-
Use an approved, temporary network toolbox to test DNS and TCP reachability from the affected container’s network namespace without changing its image.
- Keep logs, metrics, and traces outside the disposable container so a restart or host failure does not erase the evidence needed to explain an incident.
Chapter 8 turns these incident checks into an operational runbook: release, health, rollback, and evidence-capture steps a team can follow under pressure.