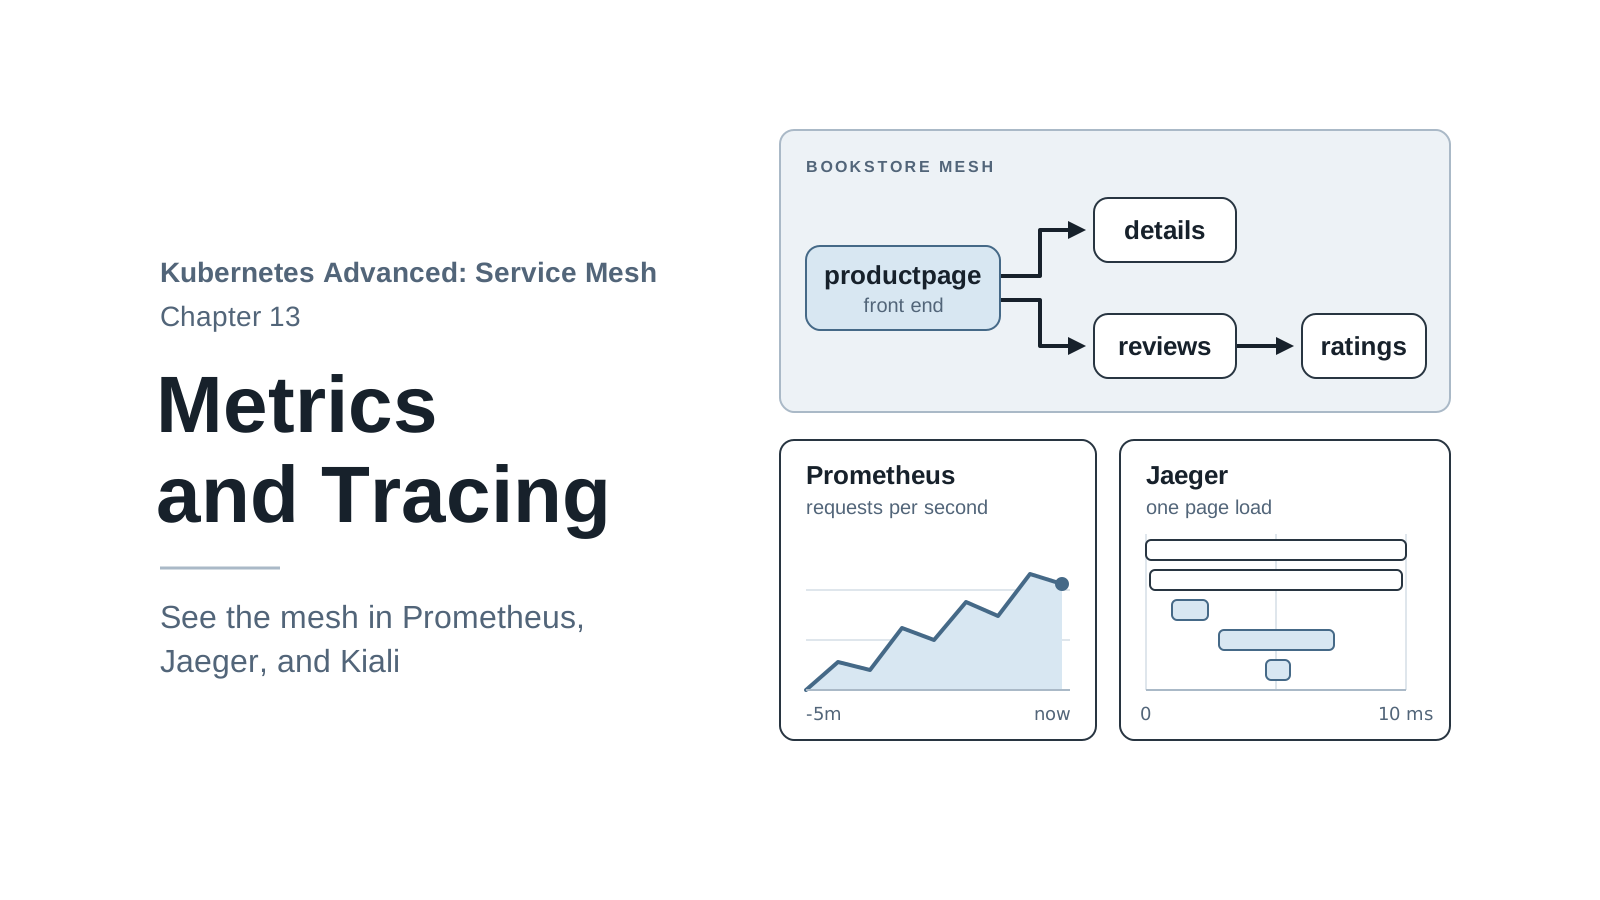
Chapter 1 asked a question that plain Kubernetes couldn’t answer: which version served this request, and what happened to it on the way? Every chapter since has answered a piece of it from access logs, one line at a time. Logs are good for one request. For a running system you need the totals: how many requests per second each version gets, how many fail, how slow the slowest ones are. And when a page is slow, you need to see where the time went across every service it touched.
The sidecars have been collecting this since chapter 2. Every Envoy counts and times every request it handles, and it can report each request as a span in a distributed trace. This chapter reads what they collected: metrics in Prometheus and Grafana, traces in Jaeger, and the traffic graph and configuration checks in Kiali. It ends with the one thing a mesh can’t do for you, which is joining a trace across an app that doesn’t pass the trace along.
By the end of this chapter you will:
- Query Istio’s standard metrics in Prometheus: traffic per version, errors by caller and response flag, and p99 latency.
- Turn on tracing with an Istio extension provider and the Telemetry API, and read one page load as a tree of spans.
- Diagnose a trace broken into two pieces, and fix it in the app.
- Know what the Grafana dashboards and Kiali add, and what changes in production.
Code for this chapter. The files are in _resource/kubernetes-service-mesh/13-observability. I tested them with Kind v0.33.0 (Kubernetes v1.37.0) and Istio 1.32.0 on macOS with Docker Desktop, and the command output in this chapter comes from those runs.
Starting Point
Run every command from _resource/kubernetes-service-mesh:
export PATH="$PWD/bin:$PATH"
The chapter needs Book Store in the mesh at http://bookstore.local:8080, and Prometheus and Kiali
from chapter 2. To build that state from scratch: ./scripts/bootstrap.sh 13. Install the other
two add-ons from the same Istio release: Grafana for dashboards and Jaeger for traces.
./cluster/addons.sh grafana jaeger
...
deployment "grafana" successfully rolled out
deployment "jaeger" successfully rolled out
Where Each Signal Comes From
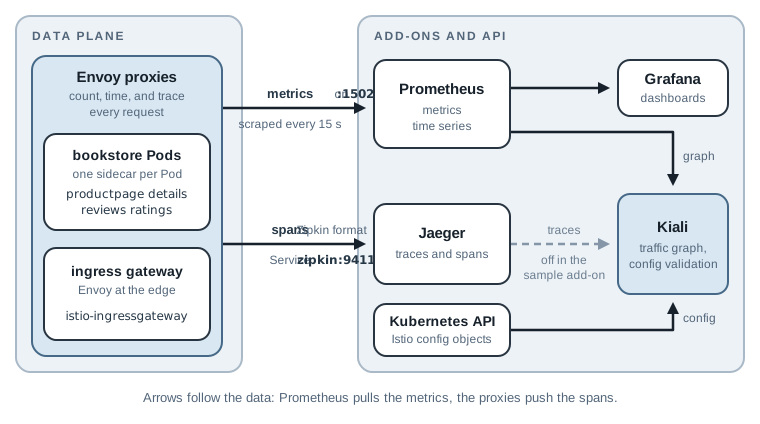
- Metrics: each Envoy keeps counters and histograms for the requests it handles and exposes them on its Pod’s port 15020. Prometheus scrapes every Pod every 15 seconds.
- Traces: each Envoy reports a span (a timed record of one request through it) to Jaeger. Spans that share a trace ID make one trace.
- Kiali reads the metrics from Prometheus and the Istio configuration from the Kubernetes API, and draws the graph. It can read traces from Jaeger too, but the sample add-on ships with that link switched off (more on that in the Kiali section).
A sidecar measures the traffic between services: who called whom, with what result, how fast. It
can’t see inside an app. A slow database query inside reviews shows up only as a slow reviews
response.
Metrics: Rates, Errors, and Latency
Istio’s main metric is istio_requests_total, a counter of requests with labels for the source,
the destination, the version, the response code, and more. Its partner,
istio_request_duration_milliseconds, is a histogram of request times with the same labels. Each
request is counted twice, once by the caller’s sidecar (reporter="source") and once by the
callee’s (reporter="destination"); pick one in every query, or you count everything twice.
Open Prometheus in a second terminal:
kubectl -n istio-system port-forward svc/prometheus 9090:9090
13-observability/promql.sh sends one query to localhost:9090 and prints each result on one
line. Generate some traffic, then ask for the request rate of each reviews version over the last
two minutes:
./scripts/count-versions.sh http://bookstore.local:8080 300 > /dev/null
./13-observability/promql.sh 'sum by (destination_version) (rate(istio_requests_total{reporter="destination", destination_service_name="reviews"}[2m]))'
destination_version=v3 1.143
destination_version=v2 0.905
destination_version=v1 0.857
Requests per second, per version, averaged over two minutes. With no routing rule on reviews,
the three versions get roughly equal shares. During a canary (chapter 6), this is the query that
shows whether v3 really gets its 10%. (If the result is empty or looks low, Prometheus hasn’t
scraped the new counts yet; wait 15 seconds and run it again.)
Latency: p99 per version
The 99th percentile, p99, is the time within which 99% of requests finish: the experience of
your unluckiest users, which an average hides. Prometheus estimates it from the histogram’s
buckets (le is each bucket’s upper bound), so treat the result as an approximation, not an
exact measurement.
./13-observability/promql.sh 'histogram_quantile(0.99, sum by (le, destination_version) (rate(istio_request_duration_milliseconds_bucket{reporter="destination", destination_service_name="reviews"}[2m])))'
destination_version=v1 3.8
destination_version=v3 21.1
destination_version=v2 19.225
Milliseconds. v2 and v3 are about five times slower at p99 than v1, because they call ratings
and v1 doesn’t. That’s the kind of difference a release review should look at before moving a
canary forward.
Errors: who failed, and why
Make something fail. Take ratings down, send 60 requests, and bring it back:
kubectl -n bookstore scale deploy/ratings-v1 --replicas=0
kubectl -n bookstore wait --for=delete pod -l app=ratings --timeout=60s
./scripts/count-versions.sh http://bookstore.local:8080 60
kubectl -n bookstore scale deploy/ratings-v1 --replicas=1
deployment.apps/ratings-v1 scaled
pod/ratings-v1-864f4f9bd8-5x85j condition met
  24 200 reviews-v3 ratings-error fast
  21 200 reviews-v1 no-stars fast
  15 200 reviews-v2 ratings-error fast
deployment.apps/ratings-v1 scaled
Every page returned 200, as in chapter 1. A dashboard watching the gateway sees no errors. Ask
for server errors anywhere in bookstore, from the callers’ point of view, grouped by caller,
destination, code, and response flag. Wait a minute first, so Prometheus has scraped the new
counts:
./13-observability/promql.sh 'sum by (source_workload, destination_service_name, response_code, response_flags) (increase(istio_requests_total{reporter="source", destination_service_namespace="bookstore", response_code=~"5.."}[5m])) > 0'
destination_service_name=ratings response_code=503 response_flags=UH source_workload=reviews-v2 40.0
destination_service_name=ratings response_code=503 response_flags=UH source_workload=reviews-v3 26.43
The failures were one hop down, between reviews and ratings: 503 with UH, no healthy
upstream, chapter 5’s flag for an empty endpoint list. reporter="source" is the right choice
here: with no ratings Pod, there was no destination sidecar to count anything. (The numbers are
increase()’s estimates over five minutes, not exact counts, and they don’t match the 39 failed
pages one to one. Read them for where the failures are, not for an exact total.)
This is chapter 1’s hidden outage, found in one query. As an alert, usually written as the share
of 5xx responses among all requests to a service, it’s a common first alert for a mesh. Change
the code filter to response_code="403" and the same query finds requests denied by
authorization policies like chapter 12’s, the check that chapter recommended after every policy
change.
Grafana dashboards
Grafana comes with Istio’s dashboards already loaded. Open it with:
istioctl dashboard grafana
Under “Dashboards”, the istio folder has the “Istio Mesh Dashboard” (every service’s traffic,
success rate, and latency on one page), the “Istio Service Dashboard” and “Istio Workload
Dashboard” (one service or Deployment in detail, inbound and outbound), the “Istio Control Plane
Dashboard” (istiod itself: pushes, errors, connected proxies), and a few more. They’re built on
the same metrics as the queries above, so the queries are what you’d copy into your own alerts.
Tracing: One Page Load Across Five Services
Tracing needs two settings that Istio 1.32 doesn’t turn on by default: where to send spans, and which requests to trace.
Register Jaeger as a provider
Where to send spans is an extension provider: a named telemetry backend declared in the mesh
configuration, which Telemetry objects then refer to by name. The zipkin provider type speaks
the Zipkin span format, which Jaeger accepts; the Jaeger add-on runs a Service named zipkin on
port 9411 for it. 13-observability/istio-tracing.yaml is an overlay for the install file from
chapter 2:
apiVersion: install.istio.io/v1alpha1
kind: IstioOperator
spec:
  meshConfig:
    extensionProviders:
      - name: jaeger
        zipkin:
          service: zipkin.istio-system.svc.cluster.local
          port: 9411
istioctl install merges the files in order, so run it with both. It updates the running
installation in place:
istioctl install -f cluster/istio-install.yaml -f 13-observability/istio-tracing.yaml -y
...
✔ Ingress gateways installed 🛬
- Pruning removed resources
✔ Installation complete
Always pass every file you installed with. istioctl install makes the cluster match exactly
the files you give it, so running it with only the overlay would install the plain default
profile: the gateway would lose its NodePort settings, the egress gateway would be removed, and
access logs would stop.
Turn tracing on with the Telemetry API
Which requests to trace is a Telemetry object, the same API chapter 5 used for access logs.
13-observability/telemetry-tracing.yaml:
apiVersion: telemetry.istio.io/v1
kind: Telemetry
metadata:
  name: mesh-default
  namespace: istio-system
spec:
  tracing:
    - providers:
        - name: jaeger
      randomSamplingPercentage: 100
A Telemetry object in Istio’s root namespace, istio-system, with no selector applies to the
whole mesh. providers names the jaeger provider from the overlay, and
randomSamplingPercentage: 100 traces every request. That is right for a lab and far too much
for production (see the end of the chapter).
kubectl apply -f 13-observability/telemetry-tracing.yaml
for i in 1 2 3 4 5; do
  curl -s -o /dev/null --resolve bookstore.local:8080:127.0.0.1 http://bookstore.local:8080/productpage
done
No restart is needed; istiod pushes the change to the sidecars over xDS (chapter 2). The five
requests give Jaeger a few page loads to show.
Read one trace
In the browser, open Jaeger with istioctl dashboard jaeger, choose the service
istio-ingressgateway.istio-system, and click “Find Traces”. Jaeger lists each service as
<app>.<namespace> of the proxy that reported the span.
To read a trace in the terminal instead, 13-observability/show-trace.py asks Jaeger’s API for the
traces of the last ten minutes, picks the one with the most spans, and prints it as a tree. The
script expects Jaeger’s API on localhost:16686, so start a port-forward in another terminal
first:
kubectl -n istio-system port-forward svc/tracing 16686:80
python3 13-observability/show-trace.py istio-ingressgateway.istio-system
trace 5d5a6ae3cb67f14719698a69d5161905 spans 9
istio-ingressgateway.istio-system    productpage.bookstore.svc.cluster.local:9080/productpage        10.0 ms  200
  istio-ingressgateway.istio-system    router outbound|9080||productpage.bookstore.svc.cluster.local; egress    10.0 ms  200
    productpage.bookstore                productpage.bookstore.svc.cluster.local:9080/productpage         9.7 ms  200
      productpage.bookstore                details.bookstore.svc.cluster.local:9080/*                       1.4 ms  200
        details.bookstore                    details.bookstore.svc.cluster.local:9080/*                       1.1 ms  200
      productpage.bookstore                reviews.bookstore.svc.cluster.local:9080/*                       4.4 ms  200
        reviews.bookstore                    reviews.bookstore.svc.cluster.local:9080/*                       4.1 ms  200
          reviews.bookstore                    ratings.bookstore.svc.cluster.local:9080/*                       0.9 ms  200
            ratings.bookstore                    ratings.bookstore.svc.cluster.local:9080/*                       0.5 ms  200
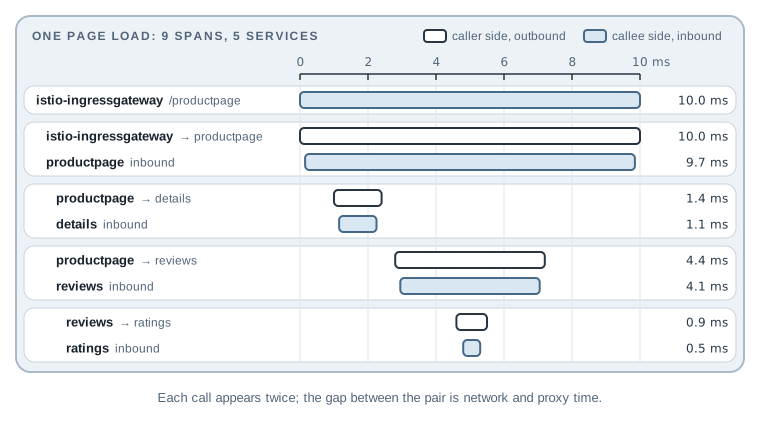
One page load, nine spans, five services. The columns are the proxy that reported the span, the
operation, the duration, and the HTTP status; indentation shows which span is inside which. The first span is the gateway receiving your request; every call
after that appears twice, once from the caller’s proxy (productpage.bookstore calling
details...) and once from the callee’s (details.bookstore receiving it). The small difference
between the two durations, 1.4 ms against 1.1 ms for details, is network and proxy time.
The order matters too. productpage calls details and then reviews, one after the other, so
the page pays for both: 1.4 ms plus 4.4 ms of the 9.7 ms that productpage took. The remaining
4 ms or so is productpage’s own work. If reviews were slow, this tree would show it at once,
and show whether the time was spent in reviews itself or in its call to ratings.
Break It: A Trace in Two Pieces
The trace above holds together because every app in it that calls another service (productpage
and reviews) copies the trace headers from its incoming request to its outgoing ones. This is
chapter 7’s header propagation again. A sidecar sees an incoming request and an outgoing one,
but only the app knows the second was caused by the first, so the sidecar can’t copy the headers
for it. Book Store’s apps were written to forward them. A new service might not be.
13-observability/storefront.yaml deploys storefront, a small Python service that another team
built. It calls productpage’s reviews API and returns the result. The interesting part of its
code:
TRACE_HEADERS = ["x-request-id", "traceparent", "tracestate", "b3",
                 "x-b3-traceid", "x-b3-spanid", "x-b3-parentspanid",
                 "x-b3-sampled", "x-b3-flags"]

class Handler(http.server.BaseHTTPRequestHandler):
    def do_GET(self):
        req = urllib.request.Request("http://productpage:9080/api/v1/products/0/reviews")
        if FORWARD:
            for name in TRACE_HEADERS:
                value = self.headers.get(name)
                if value:
                    req.add_header(name, value)
        ...
These are the headers Istio’s documentation lists for propagation: x-b3-* and b3 for the
Zipkin (B3) format the provider uses, traceparent and tracestate for the W3C format, and
x-request-id. The environment variable FORWARD_TRACE_HEADERS decides whether the code copies
them, and the manifest sets it to false. Deploy storefront with a test client in bookstore
and call it three times:
kubectl apply -f 13-observability/storefront.yaml -f 13-observability/tester.yaml
kubectl -n bookstore rollout status deploy/storefront-v1
kubectl -n bookstore rollout status deploy/tester
for i in 1 2 3; do
  kubectl -n bookstore exec deploy/tester -c tester -- curl -s -o /dev/null -w "%{http_code}\n" http://storefront:8080/
done
...
deployment "storefront-v1" successfully rolled out
deployment "tester" successfully rolled out
200
200
200
The calls work. Wait about ten seconds: sidecars send spans in batches, and listing too early shows
traces with spans still missing. Then list the recent traces that include storefront.
13-observability/list-traces.py prints the four most recent ones, oldest first, each with the
start of its trace ID, its span count, and the services in it:
python3 13-observability/list-traces.py storefront.bookstore
a19aabb739a6 2 spans: storefront.bookstore, tester.bookstore
1edaec2adb9a 6 spans: productpage.bookstore, ratings.bookstore, reviews.bookstore, storefront.bookstore
1f2cfbc54718 2 spans: storefront.bookstore, tester.bookstore
9e7723e7f77d 6 spans: productpage.bookstore, ratings.bookstore, reviews.bookstore, storefront.bookstore
Each request became two traces: a 2-span trace for tester → storefront, and a separate 6-span trace
that starts at storefront’s outgoing call. (Four lines cover two of the three requests.)
storefront appears in both traces, but nothing connects them. Its outgoing request carried no
trace headers, so its sidecar saw a request with no trace and started a new one. In Jaeger, an
engineer looking at a slow tester request would see a short trace ending at storefront, with no
hint of the work done behind it.
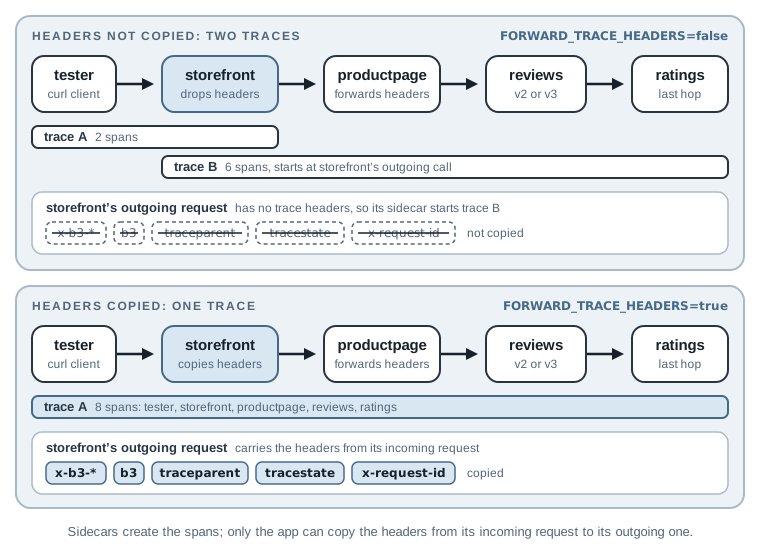
Fix it in the app. For storefront that’s the environment variable; in a real service it’s code,
usually a tracing library’s HTTP client integration (OpenTelemetry has one for most languages)
rather than a hand-made list. Turn forwarding on, call the service again, and list the traces after
the same ten-second wait:
kubectl -n bookstore set env deploy/storefront-v1 FORWARD_TRACE_HEADERS=true
kubectl -n bookstore rollout status deploy/storefront-v1
for i in 1 2 3; do
  kubectl -n bookstore exec deploy/tester -c tester -- curl -s -o /dev/null -w "%{http_code}\n" http://storefront:8080/
done
sleep 10   # let the sidecars send their spans
python3 13-observability/list-traces.py storefront.bookstore | tail -3
deployment.apps/storefront-v1 env updated
...
deployment "storefront-v1" successfully rolled out
200
200
200
4a1b41bf2443 8 spans: productpage.bookstore, ratings.bookstore, reviews.bookstore, storefront.bookstore, tester.bookstore
a21b9b6bbee2 8 spans: productpage.bookstore, ratings.bookstore, reviews.bookstore, storefront.bookstore, tester.bookstore
e7cf35d06da9 8 spans: productpage.bookstore, ratings.bookstore, reviews.bookstore, storefront.bookstore, tester.bookstore
tail -3 keeps the three newest traces: one per request, eight spans across five services. (A
request that lands on reviews-v1 gives a smaller trace, because v1 doesn’t call ratings.)
Nothing in Istio changed. “Istio gives you tracing for free” is half true: the spans are free, but
joining them is the app’s job.
Kiali: The Graph and the Config
Kiali puts the metrics on a graph, next to the Istio configuration that shapes the traffic. Open it
with istioctl dashboard kiali, go to “Traffic Graph”, select the bookstore and istio-system
namespaces, and send some traffic. Three features are worth knowing:
- Edge labels and colors. The “Display” menu can show requests per second, response time, or
the traffic split on each edge. Edges with a high error rate turn red, which would have shown
the
reviews→ratingsoutage above at a glance. - Traffic animation. Dots move along the edges, more of them where the request rate is higher. It makes a canary’s 90/10 split visible.
- Istio config validation. The “Istio Config” page lists every Istio object with a check mark
or a warning. Kiali runs its own checks, similar in spirit to
istioctl analyze. AVirtualServicethat points at a missing subset (chapter 6) shows there with an error.
Kiali can also show traces next to the graph, but not in this setup. The sample add-on ships with
that integration switched off (external_services.tracing.enabled: false in the kiali
ConfigMap), so turning it on means configuring Kiali with Jaeger’s address. This chapter leaves it
off and reads traces in Jaeger directly.
(I haven’t walked through these screens in a browser for this chapter. The list comes from the features of Kiali 2.34, the version the add-on installs, and menu names shift between Kiali versions.)
What Changes in Production
The add-ons in samples/addons are for learning. In production:
- Sampling. 100% sampling sends a span for every request through every proxy. Production
meshes typically sample 1% or less (
randomSamplingPercentage: 1). Random sampling decides at the start of a request, before anyone knows whether it will fail, so it keeps only 1% of the failures too. Teams that need every failed trace send more spans to a collector, such as the OpenTelemetry Collector, that sees whole traces and keeps the failed and slow ones (tail-based sampling). - Storage. The sample Prometheus and Jaeger store their data in an
emptyDirvolume, so it’s gone when the Pod is deleted or moved to another node. Use a managed or persistent backend: Prometheus with persistent volumes or long-term storage, and a tracing backend such as Jaeger with a real database, Grafana Tempo, or a cloud tracing service. - Metric cardinality. Every distinct combination of label values is a separate time series in Prometheus. Istio’s labels multiply quickly in a large mesh; review which ones you keep with the Telemetry API’s metric overrides.
- Access to dashboards. The sample Kiali and Grafana let anyone in without a login (Kiali’s
anonymousauth strategy, Grafana’s anonymous access). Put real ones behind your single sign-on.
Reset Before the Next Chapter
Remove the storefront and the test client. Keep the add-ons and tracing; they cost little and the next chapters don’t depend on them either way:
kubectl delete -f 13-observability/storefront.yaml -f 13-observability/tester.yaml
Stop the port-forwards and dashboards with Ctrl+C. To rebuild the starting state of chapter 14 from
scratch: ./scripts/bootstrap.sh 14.
Summary
- Sidecars count and time every request.
istio_requests_totalandistio_request_duration_millisecondscarry source, destination, version, code, and response flag labels; always filter by onereporter. - Three queries cover most needs: rate per version, p99 per version from the histogram, and
5xxby caller and flag, which found chapter 1’s hiddenratingsoutage. - Tracing needs an extension provider in the mesh config (
istioctl installwith every install file) and aTelemetryobject that turns it on and sets the sampling rate. - Sidecars create spans; apps must copy the trace headers from incoming to outgoing requests (header propagation), or a trace splits in two at that hop.
- Next, chapter 14 rebuilds the gateway and routing from chapters 3 to 6 with the Kubernetes Gateway API.